Don't be selfish

Showing posts with label Gann Angles. Show all posts

Strategy of Gann angles

Thursday, 21 August 2014


First, before explaining the strategy of Gann angles we should know about maker this strategy Gann , this man is one of the most important traders in the world of the forex market because he made a lot of strategies and these strategies won so much attention and success for most traders who work in the forex market and strategic angles Gann is one of the successful strategies to him , it  provide to you success without any effort, it is simple and can be operated by anyone who is in the field of forex, whether a beginner or a professional or even an expert and everyone knows that Gann used angles in his trading through nine square linked with the process of time, and you may have read a lot about this method and technique, but I have not grasped the link of the time with the process of trading ,in other words, that we set a time which will arrive by the price to the designated point.

How does it work strategy of Gann angles?

And generally the thing that I have concluded  , is to link the price movement with known "Gann" angles and these angles are 45, 12.5 ,63 , 90 , 112 and the basis on which Gann depending upon the movement of the price and linking it  with the angle  45 and also the selection of goals based on the process deviation above and below the angle 45 and we found that the price is based on number of couples and especially couples basic and generally the strange thing too that after consideration of the process of the daily closing of any pair that was less than the closing of the previous day and that the process of reversion will not beyond angle of 45 and also that the process of entry will be of the side  of the angle 12.5 when  deviation  of the pair to the top and if it broke ,the process changed direction to the occurrence of the process of uprising strongly and thus the process of cessation is the value of the angle 45.

An example of a strategic angles Jean:

The pair "euro / dollar" closed in day 15-4-2010 and this closure was at the point of 1.3570 and also the closure process was less points  on 14-10-2010 and here was the value of angle of 45 at the support = 1.3512 and also resistance = at 1.3628 , here the value of the angle of 12.5 resistance = 1.3586 and then the process of entering is sale target 1.3522 and is 20 points above the support angle 45 which value = 1.3512, and the pair here, the process of landing and achieved the goal and traders must that they will try strategy of Gann angles much on the demo account before the experiment on their account even know the real weaknesses and strengths, and their conclusion that such a strategy will give you daily points that not more than one hundred points and not less than 40 points once and for all.

Thus, any strategy needed learning and good training to ascertain working on it to suit the circumstances of your business and your capital and your goals.

Read more ...

Gann square of nine

Monday, 10 February 2014


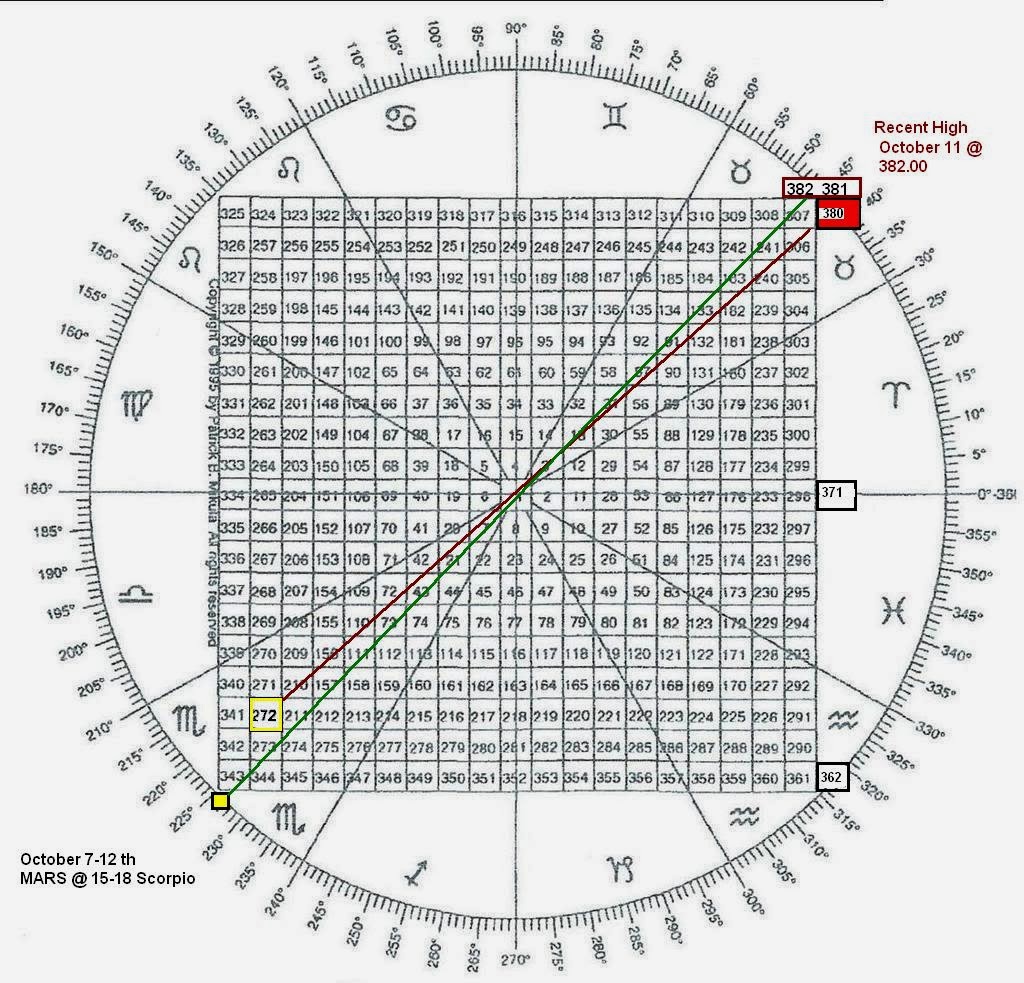
From the basics adopted by William Gann is a Square of Nine, which is a numbers arranged around each as spiral arrangement begins with a number 1 followed to the left 2 and arrange numbers then spiral in a clockwise direction until the number 9, which ends its first circle and then start numbers in the second circle of 10 to 25 and the third circle of 26 to 49 and so on to infinity.


As it is observed that the box is divided into 8 sections in the form of a circle and each section a 45 degree angle and numbers which pass the mid-constituent form (+) are called the base numbers and numbers constituent form (×) called Angle numbers.
In the first circuit consisting of 2 to 9, we find that there is only one number which is the one that separates every angle 45 "while in the second circle, composed of 10 to 25, we find that there are two numbers separate between each corner 45" while in the third circle, we find that there 3 numbers that separate each angle between 45 "and so on all the circuits.
Considering the shape of Gann square, we find that there are three circles or rings decree passing through squares of circle numbers or the initial ring which its diameter decree from square  316 to square 352 vertical and note that the quarter No. 352 is located just 8 squares left from the number 360, a figure of Full Circle diameter, which make Gann draws a first circle at this level, the circuit or the second ring, which its diameter decree of quarter 664 to quarter 716 vertical and note that the square No. 716 is located 4 squares left from the number 720, which multiplied by 360 × 2 For this reason, Gann drawing second Circuit in this place.
Circle or third ring which represents the daily calendar, which starts from March 21 and are going in a clockwise direction, which is also the diameter equal to multiplied by 360 × 3.
If we look at the square No. 4 and follow it to left angle of 45 "we find that the numbers that follow are 4, 16, 36, 64, 100 and 144 which are matrimonial numbers if we got on the of the number gives us 2, 4, 8, 10 and 12, which was even numbers ranked Sort spiral in the first circuit and the same pattern will be found in the corner bearing single digits such as angle number one if we follow it to the right you will find the numbers 9, 25, 48, 81, 121 and 169, and if we got on the of the number we find 3, 5, 7, 9 and 11 and 13 which figures ranked spiral arrangement.

Read more ...

The secret of Gann angles

Sunday, 12 January 2014


Many clever traders used Gann angles tool because it allow them to identify their entry and exit levels for great profit potential.
By the fact of studying the past Gann based his investment strategy, so as he assumed that we can predict the future:
1. There are only three factors relevant to market movement which is: Time, price, and range.
2. He considered that markets are cyclical in their nature.
3. Gann considered that market also geometric in their function and design. He sees that the movements of the markets are a reflection of human nature and it is constant over the time.
Gann’s Techniques and use of angles:
Basing on the previous ideas, Gann used three ways to predict the behavior of the market:
1. Time study, by looking at historically reoccurring dates which are derived from natural order.
2. Price study, by using support, resistance lines, pivot points, and angles.
3. Pattern study, by studying swings of the market and trend lines in addition to the reversal patterns.

Gann Angles:
In order to use Gann angles you should practice a lot, and I will give you now the basics of what you need to do:
1. Determining the units of time- you should look at the distances in which the movements of price occur, and then study charts in order to be able to determine a time unit.
See how the angles perform by putting them in the test.
The intermediate time frame (3 months) is better than daily or multiyear, it tends to produce the accurate patterns amount and it is considered the best frame to focus on.
2. Determining the high or low from drawing the Gann lines-
You should use other technical tools like Fibonacci levels or pivot points in order to achieve the best way of the above.
Gann found vibrations or price wings by analyzing charts using tools like Fibonacci numbers.
After you did the previous things you should decide which pattern to use:
1. The 1*1, 1*2, 2*1 are most common patterns, and considered purely variations of the slope of the line.
So remember that these numbers indicate the numbers of the slope and the units, for example, 1*2 is half the slope of 1*1.
2. The main basic role for Gann is that markets are cyclical in their nature so look for repeat patterns on the charts, to be able to trade.
3. In order to trade you should look for patterns and the direction will be downward on right of the high point or the right of the low point.
So we can conclude that Gann angles are important for predicting support and resistance levels.
The best formation for Gann:
Gann Angles are nine which he was using them, and when the angle is 45 degrees, price move identically in synch to time and that is the optimum balance between time and price.
So the following angle will then provide the next level of support or resistance if one of these lines is broken.
Read more ...

How to use Gann fans in trading?

Monday, 16 December 2013


Gann fan is drowning tool used in trading, William Delbert Gann developed it, and it is considered a popular trading tool. Many traders used this incredible tool for decade. So Gann Fan is the most well know indicator and it was used by Gann. 

So, series of angles basically compose Gann fan which has drawn from a pivot low or pivot high.
Gann fan has prime angle and other 8 ones, so the prime angle of it is a 45 degree 1*1 while in uptrend and 315 degree while in downtrend.  The other 8 rest angles are 1*2, 1*3, 1*4, 1*8, 2*1, 3*1, 4*1, and lastly 8*1.

Trading methods using Gann fan:

In two ways we can use Gann fan indicator, by using it for trend reversal trades and trend following. Gann fan indicator can predict the possible trend line or reversal points or retracement; in addition it basically functions as trend lines. 

Trend Continuation:

Depending on the trend direction, Gann fan indicator works as support and resistance lines like trend lines. In the case of an uptrend, we can use Gann fan to enable us to determine possible support areas and pullback zones. We can distinguish between the trend lines and Gann fan where the first one requires two low points in an uptrend, whereas in the second require one high and one low point. Thus traders can enter into trade early because Gann fan does not require, like trend line, two high points.


We can see Gann fan indicator in an uptrend through 4 hour chart of GBP/USD. By connecting one low point (1) and one high point (2) we got 1*1 line of Gann fan.  The angles 2*1 and 3*1 are considered as possible reversal point and support.  In this chart this pair has got support from 3*1 line of Gann fan and it bounced back to the prevailing uptrend.


Another example after 4 hour in chart of GBP/USD we can see Gann fan trend following trading method in a downtrend. So we find that 1*1 line has drawn by taking 1and 2 points, and we can see clearly the point 3 is showing a pullback from the resistance. We conclude that after getting resistance from 3*1 lines, the currency pair has continued its prior downtrend.

Trend Reversal:

We can use Gann fan to trade trend reversals, and it is similar to the method to trend line breakouts. A bullish reversal can be confirmed by a down trend line breakout, and as we know before that Gann fan is similar to trend lines, thus trend reversal signals can be used by these lines.


In this example, we can see a bullish trend reversal in 4 hour chart of USD/CAD. And by connecting point 1 and point 2 we can draw Gann fan. Thus entry signal generated as soon as candle breaks out 2*1 lines for long position. And we should take exit signal when candlestick hit or touches 4*1 or 8*1 line.


Now 4 hour chart of USD/CAD, we can see breakout, and entry and exit signal for a short position.
We can draw 1*1 lines by taking point 1 and point 2. As soon as candlesticks break down 2*1 lines, traders enter into a short position. So as soon as candle hits 4*1 lines, an exit signal should be taken.

Summary

Gann fan indicator can be combined effectively with many other indicators like Fibonacci retracements, trends lines, etc. so in order to draw Gann fan properly it is crucial to identify low points and swing high.
Read more ...

Gann Angles determine strength and weakness

Monday, 25 November 2013


The 1*2, 1*1, 2*1 are primary Gann angles, where the 1*1 means that the angle is moving in one unit of price for one unit of time, 1*2 means that the angle is moving in one unit of price for every two units of time, 2*1 moves two units of price with one unit of time. So as the same formula the angles can be 1*8, 1*4, 4*1, and 8*1.

So this type of analysis needs a proper chart scale, it is important. Proper chart paper was important as well as a proper chart scale to Gann in order to forecast technique because he wanted the markets to have a square relationship.

If the chart is properly scaled, using degrees to draw the angle will work, since Gann charts were square, so the 1*1 angle is often referred as the 14- degree.

So we find that the angles not only show support and resistance but also they give the analyst and the strength of the market a clue.

So the market is balanced when trading on or slightly above an uptrending 1*1 angle, while the market is a strong uptrend, when it is trading or slightly above an uptrending 2*1 angle. So the trend is not as strong when trading at or near the 1*2. And when looking at the market from the top down, the strength of the market is reserved. 

By the way anything in weak position when it is under the 1*1 angle.

Gann angles are used for Timing also:


Finally, important tops, bottoms and changes in trend are forecasted by using Gann angles. So squaring is a mathematical technique and is used to determine time zones when the market is likely to change direction. Thus when the market has reached an equal unit of price and time up or down, the main concept is to forecast the change in direction.

Note: the timing indicator works on longer term charts more than short once such as monthly or weekly charts because daily charts have a lot of tops, bottoms, and ranges to analyze.

Conclusion

Gann Angles are valuable tool for the traders and the analysts and it is the key concept in which the past, present , future exist at the same time to help the trader to analyze the market more accuracy.
Read more ...